Understand Command Center Analytics
Most hotels review Completion Rate, Biggest Drop‑Off, and Issues in under 3 minutes.
This guide explains how AVA calculates each Analytics chart in Command Center. It also explains the extra check-in coverage cards you may see.
Go to: Main Menu → Command Center → Analytics
Copy an MCP config for Codex or Claude
This takes under 1 minute. The token is short-lived and uses your current browser session.
Use these buttons when you want to send Analytics data to an AI client. The copied token also includes full Streamliner MCP scope. Supported clients can use settings tools after you restart them. After you copy, AVA shows a client-specific modal with paste instructions.
| Button | What it copies | Best for |
|---|---|---|
| Copy Codex MCP Config | A TOML MCP config with mcp_servers.streamliner | Codex |
| Copy Claude MCP Config | A JSON MCP config with mcpServers.streamliner | Claude Code or Claude Desktop |
-
Click Copy Codex MCP Config or Copy Claude MCP Config.
-
Wait for the button to change to Creating MCP token....
-
Read the modal instructions for your client.
-
Paste the copied config into your AI client config file.
-
Restart your client so it loads the new MCP server.
✓ The Claude config uses JSON. ✓ The Codex config uses TOML. ✓ Both configs include a short-lived
STREAMLINER_MCP_TOKEN.
If you copied a token before this change, copy a fresh config. Older tokens keep their previous scope until you renew them.
Codex uses ~/.codex/config.toml.
Claude uses Claude Desktop Developer config, usually claude_desktop_config.json.
What the modal shows
The modal confirms that you copied the config successfully. It then shows the file path, paste location, and restart step for that client.
If you're using Codex
-
Open
~/.codex/config.tomlon the machine where you run Codex. -
Paste the copied TOML block at the top level of the file.
-
Save the file, then restart Codex.
✓ If
mcp_servers.streamlineralready exists, replace that section.
If you're using Claude Desktop
-
Open Claude Desktop.
-
Go to Settings → Developer → Edit Config.
-
Paste the copied JSON into
claude_desktop_config.json. -
Save the file, then fully quit and reopen Claude Desktop.
✓ On macOS, the file is usually under
~/Library/Application Support/Claude/. ✓ IfmcpServersalready exists, merge only thestreamlinerentry.
Quick Reference
| View | What counts as a session | Completion rule |
|---|---|---|
| Pre‑Arrival | Any reservation that reached a Pre‑Arrival step | PRE_ARRIVAL succeeds |
| Check‑In → All | Any reservation with check‑in flow steps (including early check‑in or pre‑registration), excluding pre‑arrival‑only | CHECKIN, KEY_COLLECTION, or GET_DOOR_LOCK_KEY |
| Check‑In → Early Check‑In | EARLY_CHECKIN_ATTEMPT or ROOM_ASSIGNMENT_QUEUED | EARLY_CHECKIN_ATTEMPT or ROOM_ASSIGNMENT_QUEUED succeeds |
| Check‑In → Pre‑Registration | Any reservation with Pre‑Registration steps | PRE_REGISTRATION succeeds |
| Check‑In → Full Check‑In | CHECKIN, KEY_COLLECTION, or GET_DOOR_LOCK_KEY | CHECKIN, KEY_COLLECTION, or GET_DOOR_LOCK_KEY succeeds |
| Check‑Out | Any reservation with checkout steps | CHECKOUT or COMPLETED_CHECKOUT_PAYMENT succeeds |
Open Analytics and choose a view
-
Go to Main Menu → Command Center.
-
Select the Analytics tab.
-
Choose Pre‑Arrival, Check‑In, or Check‑Out.
-
If you select Check‑In, use the sub‑tabs: All Check‑Ins, Early Check‑In, Pre‑Registration, or Full Check‑In.
✓ All charts update to that view and date range.
How AVA builds a session
- A session is one reservation check‑in record (not each guest).
- A session is included when at least one step from that view is logged.
- Failed steps still count in totals so you can see drop‑offs and issues.
Pre‑arrival sessions are not included in All Check‑Ins. Use the Pre‑Arrival view for those.
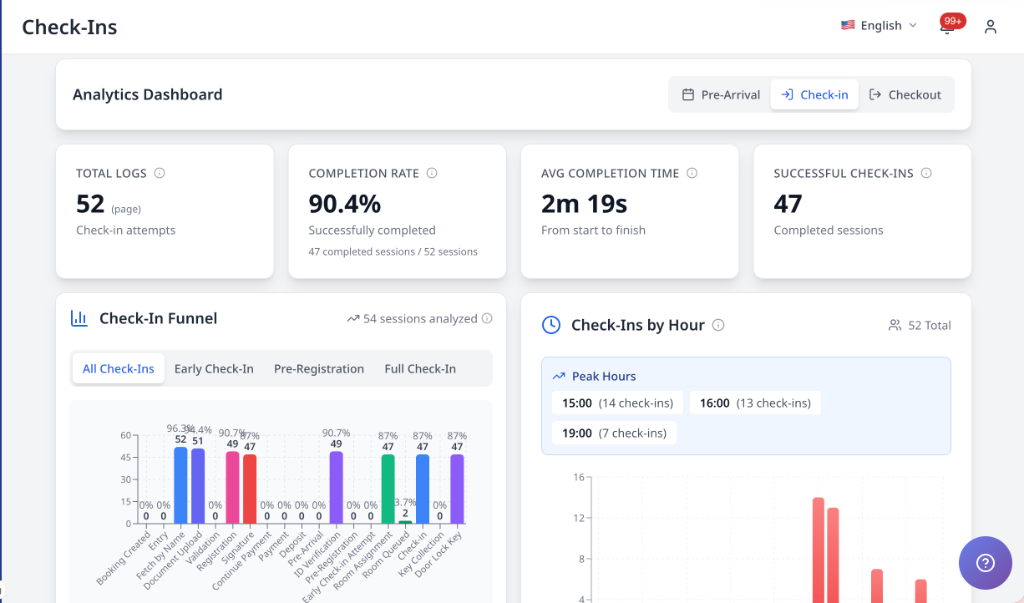
Summary cards (top of the tab)
| Card | How it is calculated |
|---|---|
| Total Logs | Number of sessions in the selected view |
| Completion Rate | Completed sessions ÷ total logs |
| Avg Completion Time | Time from the first successful step (usually Entry) to completion |
| Successful Check‑Ins / Check‑Outs | Number of completed sessions for that view |
What counts as completion depends on the view (see the Quick Reference table).
Use this table to confirm which sessions count as complete before you compare periods.
If Total Logs is 40 and Successful Check‑Ins is 28, the completion rate is 70%.
Check-in coverage cards
When AVA receives coverage data from your PMS, you may see two extra cards after Completion Rate. This works for AVA PMS, Cloudbeds, Opera, Mews, and eZee.
| Card | What it shows | Why it matters |
|---|---|---|
| Eligible Check-In Units | Distinct confirmation or sub-reservation units in the selected period | This is the coverage denominator |
| AVA Check-In Share | Percentage of eligible units that AVA processed at least once | This shows AVA adoption for that period |
These cards count units, not whole reservations. A multi-room booking can add more than one eligible unit.
If your PMS is OPERA, AVA ignores PM, PF, and PX pseudo rooms in the eligible unit count. It also uses top-level room type fields when room rows are sparse, so real guest rooms still count correctly.
AVA also dedupes linked OPERA reservation families by parent confirmation. That keeps terminal sibling rows from inflating Eligible Check-In Units.
If AVA marks sessionsMapMeta.truncated as true, it ignores that partial map.
It then uses full check-in logs for the share calculation when available.
If AVA cannot get complete logs, the coverage cards stay hidden.
AVA counts each processed reservation once. It uses the session map when that map is complete. If the session map is missing or truncated, it uses raw log identities instead. This keeps AVA Check-In Share aligned with reservation coverage. It should stay at or below 100%.
If you refresh the same date range again, AVA may reuse the last coverage result for a short time. This keeps the Analytics tab fast during repeated checks.
Check-In Share Looks Wrong
What you see: AVA Check-In Share is higher than expected.
Fix:
- Refresh the Analytics tab.
- Confirm the date range matches your PMS report.
- Check that your property uses a supported PMS.
- If it still looks wrong, contact support with a screenshot.
If you do not see these cards, your current PMS data may not include unit coverage metrics. Unsupported PMS providers do not show these cards.
Funnel chart (drop‑offs and step timing)
The funnel shows the percentage of sessions that reached each step.
- Drop‑off compares each step to the step before it.
- Avg Stage Duration measures time spent inside the stage, from stage start to stage success.
- Avg Time to Next Step measures time from one successful step to the next.
- The Slowest Step card uses stage duration first.
- If AVA does not have stage timing, it falls back to the next-step duration.
- If a later step happens earlier than the prior step, the duration is shown as 0.
Use the Biggest Drop‑Off card to pick the step that needs coaching first.
If Document Upload has 60 sessions and the prior step has 100, drop‑off is 40%. If Document Upload itself takes 20 seconds, Avg Stage Duration is 20 seconds. If Document Upload completes at 10:05 and Validation at 10:07, Avg Time to Next Step is 2 minutes.
Time Analysis (hourly volume)
Time Analysis groups sessions by the first successful step in the selected view.
- Uses your hotel’s timezone.
- Pre‑Arrival requires a successful PRE_ARRIVAL step.
- Shows Peak Hours and Rush Periods to help with staffing.
Use Peak Hours to plan coverage for your busiest time blocks.
A session that first succeeds at 7:10 local time counts in the 07:00 hour.
Issues (recent failures)
Issues list sessions with the most recent failed steps.
- AVA checks the last 10 events for failures.
- If no recent failures exist, it uses the most recent failure on record.
Use View Details to see full step history.
If a payment failed at 3:12 after earlier success, the issue shows Payment at 3:12. If the last 10 events are successful, AVA shows the most recent failure on record.
Recent Activity
Recent Activity shows key steps that were successful or failed, such as:
- Check‑In, Check‑Out
- Room Assignment
- Pre‑Registration
- Identity Verification
- Payment
This list is capped to the latest 30 items.
Use this list to confirm which steps were completed most recently.
You may see “Check‑In completed successfully” or a failure message for Identity Verification.
Final Step Distribution (where sessions end)
This chart groups the last step of each session into categories:
- Success — Full completion steps
- Timing — Early check‑in steps (including Room Queued)
- Partial — Pre‑registration
- Room — Room assignment steps (Room Assignment)
- Documentation — Document or ID verification
- Payment — Payment steps
- Early — Entry / Fetch steps
If a failure happens after the last success, the failure step becomes the final step.
Use this chart to see the most common stopping points.
Out of 50 sessions, 20 end at Check‑In (success), 10 at Early Check‑In (timing), 8 at Document Upload (documentation), and 12 at Payment (payment).
Open sessions from the Final Step Distribution
-
Select a bar segment in Final Step Distribution.
-
Review the session list that opens.
✓ The list shows confirmation number, guest, room, and the latest failure.
-
Select Open details on any session.
✓ The Reservation Details panel opens for that session.
The list shows sessions, not grouped reservations. Use it to spot repeat failures fast.
Device Analytics (optional)
Device Analytics uses the device details from the check‑in/out session.
If guests did not provide device information, this chart may be empty.
Use this view to compare kiosk vs mobile usage by OS.
If most sessions are iOS, you may want to optimize the mobile check‑in flow.
Limits & data freshness
- Analytics covers up to 90 days per query.
- If more than 50,000 events fall in the range, AVA asks you to narrow the dates.
- Session lists are capped for performance (about 200 per step and 2,000 total).
Troubleshooting
All charts show zero
What you see: Summary cards show 0 and charts are empty.
Fix:
- Expand the date range.
- Confirm there are logs in Status.
- Check if your plan includes Analytics.
Completion rate looks lower than expected
What you see: Completion rate is low even though many guests checked in.
Check:
- Sessions in Pre‑Arrival do not count toward All Check‑Ins.
- All Check‑Ins only treats Full Check‑In steps as completed.
- Early Check‑In and Pre‑Registration are tracked in their own sub‑tabs.
Coverage cards are missing
What you see: You only see the standard summary cards.
Fix:
-
Stay on Check-In.
-
Confirm your PMS connection is active.
-
Refresh the page after sync finishes.
-
If the date range is busy, refresh again after a few minutes.
✓ If your PMS supports reservation coverage, Eligible Check-In Units and AVA Check-In Share appear after Completion Rate.
Coverage cards still look unchanged
What you see: Eligible Check-In Units or AVA Check-In Share still looks the same after a refresh.
Fix:
- Wait a minute.
- Refresh the Analytics tab again.
- Confirm the date range matches the PMS update you expect.
- If it still looks wrong, check that PMS sync has finished.
MCP config copy fails
What you see: The button shows an error after you click Copy Codex MCP Config or Copy Claude MCP Config.
Fix:
- Stay on the Analytics tab.
- Try the copy button again.
- Refresh the page and retry if the token request timed out.
- If the error stays, contact support with the exact message.
Config copied, but the client cannot connect
What you see: The modal opens, but Codex or Claude does not load the Streamliner server.
Fix:
- Check that you pasted the config into the correct file.
- Confirm the
STREAMLINER_MCP_TOKENvalue is still present. - Restart the client completely.
- Copy a fresh config if setup took too long.
Settings tools are missing
What you see: Your client connects, but settings actions do not appear.
Fix:
- Copy a fresh config from Analytics.
- Restart the client completely.
- Confirm the pasted
STREAMLINER_MCP_TOKENis the latest one. - Remove any older Streamliner config block if it is still present.
Settings writes time out
What you see: A settings save looks stuck, then returns a timeout or cancel message.
Fix:
-
Copy a fresh config from Analytics.
-
Restart the client completely.
-
Try the settings change again.
-
If it fails again, check whether your token or session expired.
✓ Valid settings updates should finish instead of hanging.
Authentication failed on a settings write
What you see: You get an authentication error when saving merchant settings.
Fix:
-
Copy a fresh config from Analytics.
-
Restart the client completely.
-
Retry the settings change in the same hotel.
-
If you switched hotels, refresh the config after the switch.
✓ The new error should tell you to generate a fresh MCP config/token.
Still Stuck?
Contact success@vouch-technologies.com if:
- ❌ Analytics shows data in Status but Analytics is empty
- ❌ Charts never update after changing the date range
- ❌ Issues list shows incorrect timestamps
Helpful to include:
- Date range you selected
- Screenshot of the Analytics tab
- Confirmation number of a sample reservation